Measuring urban quality of life - some challenges in practice
We have come a great way in attempting to define what quality of life and wellbeing are, as ultimate goals urban policies. In this post, I argue that for many cities, particularly in middle-income and low-income countries, there are significant data lacks at an intra-urban level, hindering evidence based urban planning. I point out some alternative ways of collecting and analyzing data and highlight the need for open data and investments in standardized data collection.
If one would attempt to implement a survey targeting urban planners asking them what the ultimate purpose of their work is, I would say that improving quality of life for urban dwellers would come up quite frequently.
“Quality of life”, this crossroad of all urban policies, is generally agreed by international organisations (OECD, UN) to represent human welfare, as measured by social indicators. Without going in depth in the academic debate, it is important to say that changes in the measurement of wellbeing were triggered by the idea that traditional economic indicators such as GDP or production do not succeed in showing what makes people happy or unhappy. Hence, a variety of indices attempting to portray some of the most relevant social factors influencing our “quality of life” or “wellbeing” have been developed. The United Nations’ Human Development Index proposed by economist Amartya Sen is possibly the best known, but others have emerged more recently, such as the OECD Better Life Index, which allows comparison of wellbeing across countries, based on 11 topics, including: housing, income, jobs, community, education, etc. Unfortunately, only for 36 countries for the time being, but more recently it also allows comparison between regions in these countries and a perception survey on what matters most in terms of wellbeing, to people around the world.
When it comes down to cities, the UN-Habitat developed its set of “Global Urban Indicators”, which contains a set of 30 key indicators and nine qualitative data. While the initiative is probably one of the most comprehensive attempt so far, it does rely on voluntary participation of local urban observatories, city-based institutions or regional consultancies working directly funded by UNCHS. In Europe, Eurostat’s Urban Audit database contains some selected indicators for a range of European cities, but a look at the key existing data sets shows there is room for improvement. For example, the “living conditions” data set only includes information on private households, lone parents or lone pensioners. This is complemented by a regular perception survey of quality of life in European cities, which is based on a sample of 79 cities across Europe and measures people’s satisfaction with respect to culture, public transport, recreational facilities and the like.
Of course all these indices and studies can reveal a series of interesting results, but they rather serve the purpose of comparison between cities and much less the day to day work of a planner. When it comes down to urban planning, defining priorities for a city, investment or opportunity areas, it is more worthwhile to compare areas or neighbourhoods within cities. Towards this goal, some governments have been improving their ways of working with data. For example the UK Census data is available online at a neighbourhood, ward and sometimes even smaller geographical scale (LSOA), which makes it possible to produce fine grain analyses. Others are increasingly using data from a variety of sources, as a colleague pointed on this blog not long ago. But for many middle-income and low-income countries data availability at an intra-urban level is problematic, and hinders their capacity to develop evidence based policies. This may seem obvious for cities in developing countries, where informal settlements are rapidly expanding and it is difficult to monitor population numbers.
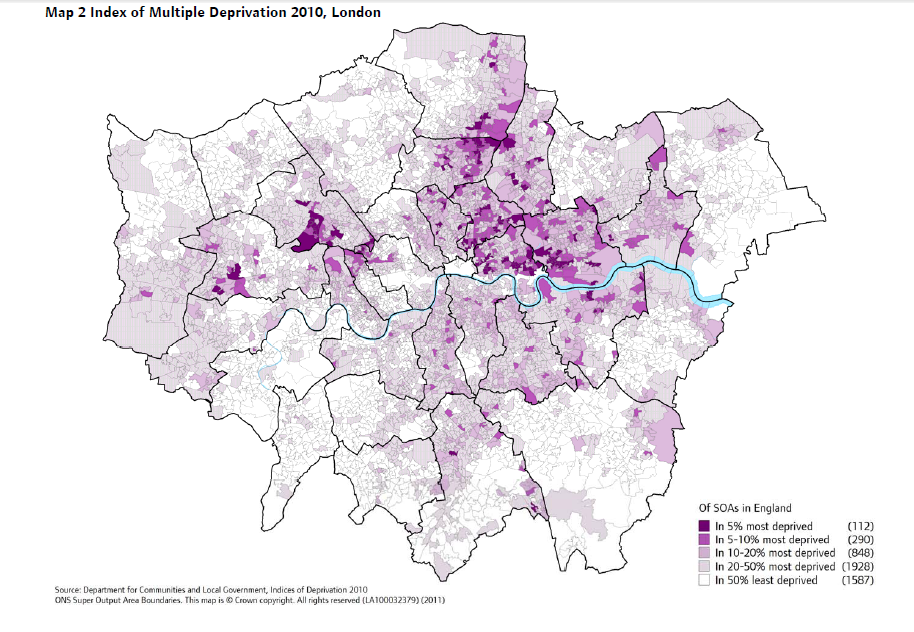 London Deprivation Map, 2010. Source: DCLG
Part of the research that I am undertaking at the moment, via a grant from the Open Society Foundation aims to deal specifically with this issue in Romanian cities. Because data collected via the national census is only aggregated at a city level, it is difficult to perform adequate analysis at an intra-urban level, when data such as population numbers, household numbers or overcrowding rates are lacking. While attempting to identify the main data sources and some alternative ways of collecting data, I am aiming to define a methodology of how an analysis of intra-urban disparities can be performed in Romanian cities. Naturally, a complex Index such as the UK Urban Deprivation Index is a difficult task to undertake, so for my research I am merely focusing on three sets of indicators: housing, mobility and labour markets.
So how does one attempt to draft such a methodology, when there is no official statistical information at a sub-city level? One way, which I am exploring in my research, is to work with local institutions to process data which is usually gathered in a raw form and not used for planning purposes. For example, social departments of local public authorities usually “sit” on a lot of information regarding socially deprived groups but this is merely used for financial and social aid purposes. By analyzing the way in which this data is collected, some minor changes and ways of centralizing data can be suggested, which can be later on scaled up and used by all Romanian municipalities, not just on a case-study approach. A second option is to try to generate this data, where it does not exist. Online surveys and online mapping are the most cost-effective tools which come to mind. In a pilot project focusing on Bucharest, for example, we attempt to collect information from users on a variety of topics (mobility, public space, urban economy) through a user-friendly questionnaire. Lastly, there is always the option of using the best available proxy. For example, no population data at a neighbourhood level is published / collected by the National Institute of Statistics, but electoral census data offers such information at a micro-scale, even though it is less accurate.
Undoubtedly, there are many limitations to the above alternative methods of collecting and using data. What would greatly improve the way we plan for cities in middle-income or low-income countries is to develop standardized methods for statistical research at the intra-urban level, to ensure access to open data and to invest in data collection. But until we get there, part of our work is a “trial and error” process and I am looking forward to hearing your stories of how you work with and around data limitations.
When you subscribe to the blog, we will send you an e-mail when there are new updates on the site so you wouldn't miss them.
Comments 2
[…] During 2015, Fabian Wenner and Irina Paraschivoiu have delivered their latest post (for the time being, at least!) as regular contributors, debating respectively rent affordability and control in Germany, and the challenges to measuring urban quality of life. […]
[…] Measuring urban quality of life – some challenges in practice, by Irina Paraschivoiu (2015) (720 views) […]