The Two Dimension of the UHI
UHI is mainly dependent on the modification of the urban energy fluxes and, as a consequence, on the synoptic conditions in urban and rural sites. UHIs are characterized by two dimensions: an extension and a vertical profile. Typically, the UHI is plotted with closed isotherms indicating the area of the urban surface characterized by high temperatures (Oke, 2006).
Figure 1 Urban heat island isotherms. Credit: United States Environmental Protection Agency
The cross-section – that is also the icon through which the UHI is represented – typically possesses ‘cliffs’ at the urban-rural fringe and a ‘peak’ in correspondence of the most built-up core of the cities (Pon, 2007).
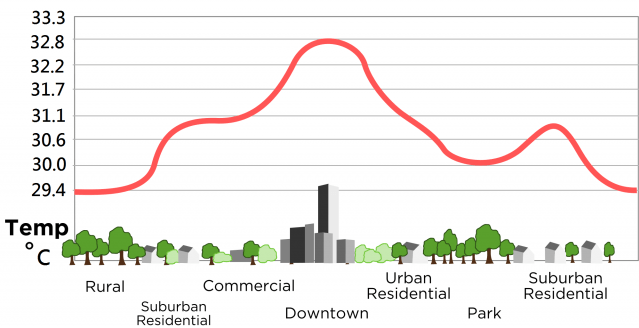
Figure 2 Urban heat island cross section. Credit: Geography
The UHI Extension
As demonstrated in many studies, the UHI dimension depends on the city-core extension, the most densely urbanized areas of the city (e.g., Unger, Sümeghy, Gulyás, Z., & Mucs, 2001). In the city core the natural energy balance is mostly modified by the substitution of natural materials with man-made ones (Oke, 1982). At meso-scale, in calm weather conditions, UHI has the shape of a dome at urban boundary layer; while, in case of steady regional airflow its shape is a plume at planetary boundary layer (Oke, 2006; Shahmohamadi, Che-Ani, Ramly, Maulud, & Mohd-Nor, 2010).
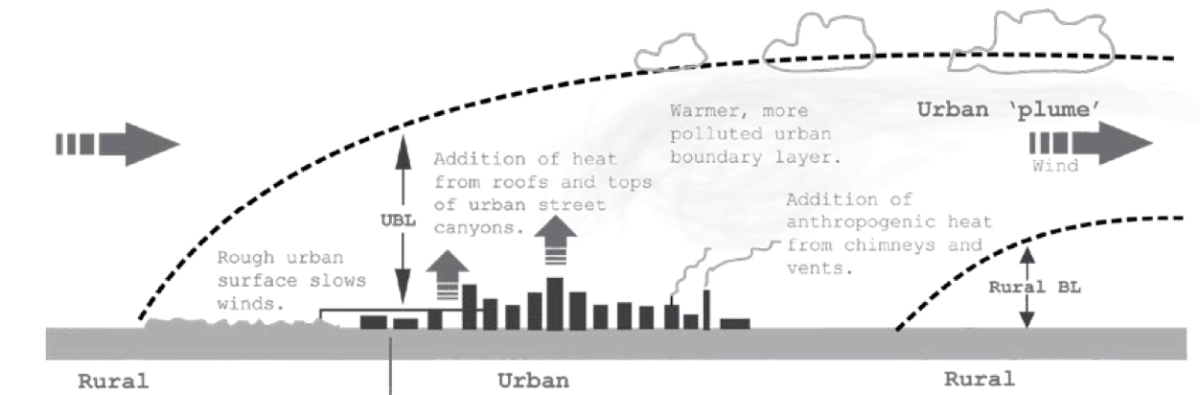
Figure 3 Urban plume. Credit: modified after Oke, 1987
The variation of the natural energy balance determined by the local urban morphology (Santamouris, 2006; He, Liu, Zhuang, Zhang, & Liu, 2007) provokes climatic variations also at local scale (i.e., urban canopy layer).
The effects of UHI at different scales can be summarized as follows:
- Micro-scale: the micro scale, in the urban pattern, is representative of the dimension of a building, a street or a courtyard. Thus, its dimension is of just few meters or less. Every modification in the energy budget at this scale, gives rise to a modification in air temperature, considered in the local and instantaneous change in punctual urban climate (Oke, 2006);
- Local scale: the local scale does not take into account the micro scale changes in temperature but considers the topography and the climate of neighborhoods. Commonly this scale has an extension ranging from one to several kilometers (Oke, 2006);
- Mesoscale: at this case, the information about the climatic conditions are at the urban scale, for this reason all the city have to be monitored by several stations. The scale is of several kilometers (tens kilometers) (Oke, 2006).
Oke defined an empirical correlation between the magnitude of the UHI and population for both American and European cities (Landsberg, 1981). For the North American evaluation, Oke plotted the data about UHI recorded in ten settlements in Quebec and eight cities in the other states. He determined through a regression analysis the following relationship valid for the North-American cities:
ΔT(U-R) max=3.06 logP – 6.79
Equation 1 Maximum UHI intensity in North-American cities. Source: (Oke, 1976)
The relationship between population and UHI maximum intensity (equation 2) explains 96% of the variance with a standard error of ±0.7°C (Oke, 1976).
For the European cities the same relationship is explained by the following formula:
ΔT(U-R) max=2.01P – 4.06
Equation 2 Maximum UHI intensity in European cities. Source: (Landsberg, 1981)
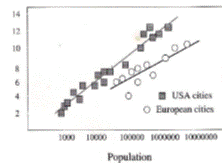
Figure 4 Relationship between urban population and the maximum UHI (Source: Oke, 1982)
Oke analyzed different cities characterized by topographic elements of minimal influence on UHI (Oke, 1982). Population was chosen as a synthetic parameter in order to evaluate the increase of urban temperature because it is characteristic not only of the number of people living in a city but also of anthropogenic heat release and alteration of surface conditions. The difference between the regression analysis carried out for the North-American cities and the European ones is the symptom of how differently cities have been built up in the two continents (figure 4). Moreover, Oke (1973) found an empirical correlation between UHI and population (P) and mean wind speed (ū):
ΔT(U-R) =0.25 P1/4 /ū 1/2
Equation 3 Relationship between population, mean wind speed and UHI Intensity
Bonan (2002) revised the previous relations between UHI and population as follows:
ΔT(U-R) =5.21 Log10(P) – 11.24
Equation 4 Relation between UHI and population in North-American cities
ΔT(U-R) =3.02 Log10(P) – 3.29
Equation 5 Relation between UHI and population in European cities
Many other studies focused on the relationship between urban sprawl and urban temperatures. The analyses of the temperatures of the last 148 years, conducted by Bacci and Maugeri (1992), reveal an increase in the difference between urban and rural temperatures of 1.4°C in the last decades in Milan. Bacci and Maugeri also analyzed the relation between the urban sprawl and the UHI in Milan. According to the authors, the UHI (∆Tu) in Milan can be expressed through the increase in the city radius (R) as follows:
∆TU-R = 0.39 ln (R/R0) + 0.87
Equation 6 Relationship between Milan city radius and the UHI
or
∆TU-R = 0.86 (R/R0)0.40
Equation 7 Relationship between Milan city radius and the UHI
Where T is the air temperature expressed in degrees Celsius [°C], R is expressed in [km], and R0 is equal to one kilometer.
Crisci et al. conducted the regression analysis of the temperature series recorded in Florence. Furthermore, the authors measured the influence of urbanization on the temperature series by regression analysis. The temperature data series in Florence were recorded by the Peretola Observatory placed on a rural site, and by the Ximeniano Observatory, an urban site, in the time periods: 1951-1974 and 1975-1994. By the regression analysis, the authors found that the mean difference between the rural temperatures and the urban ones was approximately 0.7°C for the period 1951-1974, besides for the period 1975-1994, the mean difference was 1.2°C. The increase in temperatures was not constant during the period 1878-1997, but was particularly concentrated in the periods 1920-1950 and 1951-1997. During the period 1920-1950, the increase in temperatures was only evident in the summer months, while in the period 1951-1997, the warming was evident throughout the whole time period. The authors attributed the rise in temperatures to both global and urban warming. Most of all, the increase in temperatures has been more evident since the early sixties (the economic and building boom time period).
The correlation between the increase in the urban temperature and the urban sprawl in Rome is confirmed by Bonacquisti et al. (2006). Comparing the minimum temperatures in the period 1964-75 (the period of the most consistent urban growth) with 1831-1910, the authors observed a rise of 1°C. Moreover, the authors affirm that the UHI in Rome mainly depends on the thermal properties and on the urban geometry, but it is not strongly influenced by anthropogenic heat releases. Colacino and Lavagnini (1982), in their study, attribute the presence of the UHI in Rome not only to the modification of the urban structure but also to the distance from the coastline. The maximum temperatures recorded during summer and winter in Rome, in an inland suburban area and in a coastal site, were compared. The results of their inquiry show that the sea breeze mitigates the maximum temperatures both during summer and during winter. The effects of the sea breeze are visible up to a distance of approximately 10 km.
[….To be continued]
References
Bacci, P., & Maugeri, M. (1992). The urban heat island of Milan. Il nuovo cimento, 15 (4).
Bonacquisti, V., Casale, G. R., Palmieri, S., & Siani, A. M. (2006). A canopy layer model and its application to Rome. Science of the Total Environment (364), 1-13.
Colacino, M., & Lavagnini, A. (1982). Evidence if the Urban Hest Island in Rome by Climatological Analyses. Arch. Met. Geoph. Biokl. (31, Ser. B), 87-97.
Crisci, A., Gozzini, B., Maracchi, G., & Meneguzzo, F. (n.d.). http://www.clima.ibimet.cnr.it/attachments/gilia/La_serie_storica_delle_temperature_medie_mensilli_di_Firenze.pdf. Retrieved March 2009
He, J. F., Liu, J. Y., Zhuang, D. F., Zhang, W., & Liu, M. L. (2007). Assessing the effect of land use/land cover change on the change of urban heat island intensity. Theoretical and Apllied Climatology, 90, 217-226.
Landsberg, H. E. (1981). The Urban Climate (Vol. 28). New York: International Geophysics Series.
Oke, T. R. (1973). City size and the urban heat island. Atmospheric Environment, 7, 769-779.
Oke, T. R. (1976). The distinction between canopy and boundary layer urban heat islands. Atmosphere, 14, 268-277.
Oke, T. R. (1982). The energetic basis of the urban heat island. Quarterly Journal of the Royal Meteorological Society, (108), 1-24.
Oke, T. R. (2006). Instruments and Observing Methods – Initial Guidance to Obtain Representative. (W. M. Organization, Ed.) Retrieved August 30, 2010, from World Meteorological Organization: http://www.wmo.int/pages/index_en.html
Pon, B. (2007). High Temperatures. Retrieved September 12, 2010, from Heat Island Group: http://heatisland.lbl.gov/HighTemps/
Santamouris, M. (2006). Environmental design of urban buildings. An integrated approach. London: Earthscan.
Shahmohamadi, P., Che-Ani, A. I., Ramly, A., Maulud, K. N., & Mohd-Nor, M. F. (2010). Reducing urban heat island effects: A systematic review to achieve energy consumption balance. International Journal of Physical Sciences, 5 (6), 626-636.
Unger, J., Sümeghy, Z., Gulyás, Á., Z., B., & Mucs, L. (2001). Land-use and meteorological aspects of the urban heat island. Meteorology Applied, 8, 189-194.
* Rearranged text from:
Susca, T. (2011). Evaluation of the Surface Albedo in a LCA Multi-scale Approach. The Case Study of Green, White and Black Roofs in New York City. Ph.D. Thesis