3 min read
Editor's note: This post is the concluding post in a series of entitled 'Mapping - a tool to build urban resilience' (see post 1 about community-led heritage mapping, and post 2 about environmental resources mapping for sustainable agriculture). This post highlights the value of cognitive mapping to grow our collective understanding of neighbourhoods, looking at an early example of its use in Boston (MA) and how it has also been used in a neighbourhood located close to Nairobi, Kenya. It concludes with key take-aways about the value of mapping for urban resilience across the world.
Rapid urbanization has largely impacted the quality of life in cities. This is specifically true for informal urban settlements, which are often unplanned and lack basic infrastructure such as lighting, sewage, drainage, and electricity. According to the International Growth Centre, 86% of dwelling units in Delhi’s slums do not have a water connection. Such settlements are usually side-lined in top down planning processes.
Public engagement into the planning process can help include such settlements into the urban development discussion. Here, cognitive mapping can be an effective tool. A cognitive map is a roughly sketched map anyone can do to visualise their city or neighbourhood. This opens several opportunities: citizens can bring in very specific information only they can collect, they feel empowered and such mapping unveils a very personal perception of the area. Kevin Lynch introduced the concept in the Image of the City in 1960 stating that as people interact with their surroundings, they interpret and encode them into mental maps.
Here is an example to understand cognitive mapping better. In 1970, Florence C. Ladd asked a number of black children living in the Mission Hill area of Boston, Massachusetts, to sketch maps of their area, and interviewed them about their maps. The map drawn by one child, Dave (below), shows his neighbourhood at the top. The Mission Project area, where the white children live, is represented at the bottom of the map. For Dave, the significance of the Mission Project area is highlighted by rendering it as relatively larger, more prominent and more central than his own neighbourhood (Ladd, 1970). This demonstrates how differently Dave perceives the two neighbourhoods.
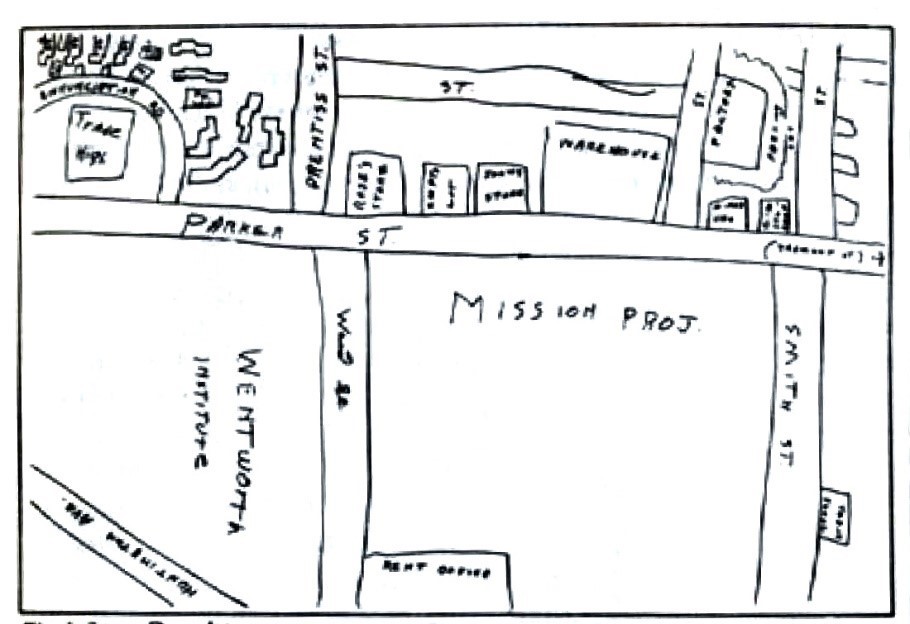
Cognitive map of a Dave’s neighbourhood
Source: Cognitive Mapping and Social Change
Communities can greatly help city planning through cognitive mapping. It is an informal and engaging tool of public participation through which planners can understand how communities perceive their urban surroundings. This establishes a ground for joint discussion to plan better urban areas. The approach can provide practical information about roads, streetlights, stormwater drains, or footpaths to urban practitioners, city planners and decision-makers. Cognitive mapping can also help understand the identity of cities and neighbourhoods. This information can then be used to make inclusive spaces which meet the needs of the city.
Community representatives discussing planning needs with official representatives Source: Kiandutu Settlement profiling and mapping begins
Kiandutu settlement, Kenya, is located on a 94 sqkm land. Its residents face a lack of sewage infrastructure, poor housing quality and poor water access. So the University of Nairobi and Muungano Support Trust Redevelopment supported the community with cognitive mapping. This initiative understood that locals can gather data about their neighborhood efficiently, which can greatly influence the planning of their settlement.
As a result, the community itself collected data through the Kiandutu’ Participatory Settlement Profile and Mapping Project. This data helped the settlers understand their infrastructural needs. They realized that a lack of community gathering spaces, poor housing conditions and lack of sewage infrastructure needed to be addressed in priority. This understanding led the community to act and reach a major change by building a new community hall, improving housing and sanitation facilities.
Links for further reading
https://www.muungano.net/browseblogs/2014/05/22/regularisation-of-informal-settlements-a-tale-of-kiandutu-slumshttps://www.muungano.net/browseblogs/2015/08/06/kiandutu-settlement-profiling-and-mapping-beginshttps://www.witpress.com/Secure/elibrary/papers/SC17/SC17037FU1.pdf
Take-aways
Clearly, mapping can bring our resilience actions to a whole different level. The next step is to fully integrate it into our resilience strategies. This has already been successfully done in selected cities. In 2013, the Minneapolis Climate Action Plan recommended strategies to increase energy efficiency, the number of bike lanes and active transport, recycling and composting after mapping vulnerability factors such as urban heat island effect, lack of access to public transport and neighbourhoods prone to flooding. Melbourne enhanced its urban resilience by mapping its metropolitan area’s biodiversity in 2017. This baseline map helped draw up urban forest precinct plans to protect and expand green cover in the city. As a result, today 25% of the city’s public land has a forest canopy cover, and this share continues to increase. UNICITI works with mapping experts to address issues discussed here.
Biography

Olga Chepelianskaia is principal consultant and founder at UNICITI. Olga has international technical field experience in over 20 Asian cities and 40 Asian countries, conducted in the frame of programs and projects implemented for a number of international development institutions such as the ADB, CDIA, UNECE, UNEP, UN ESCAP or UNDP.